
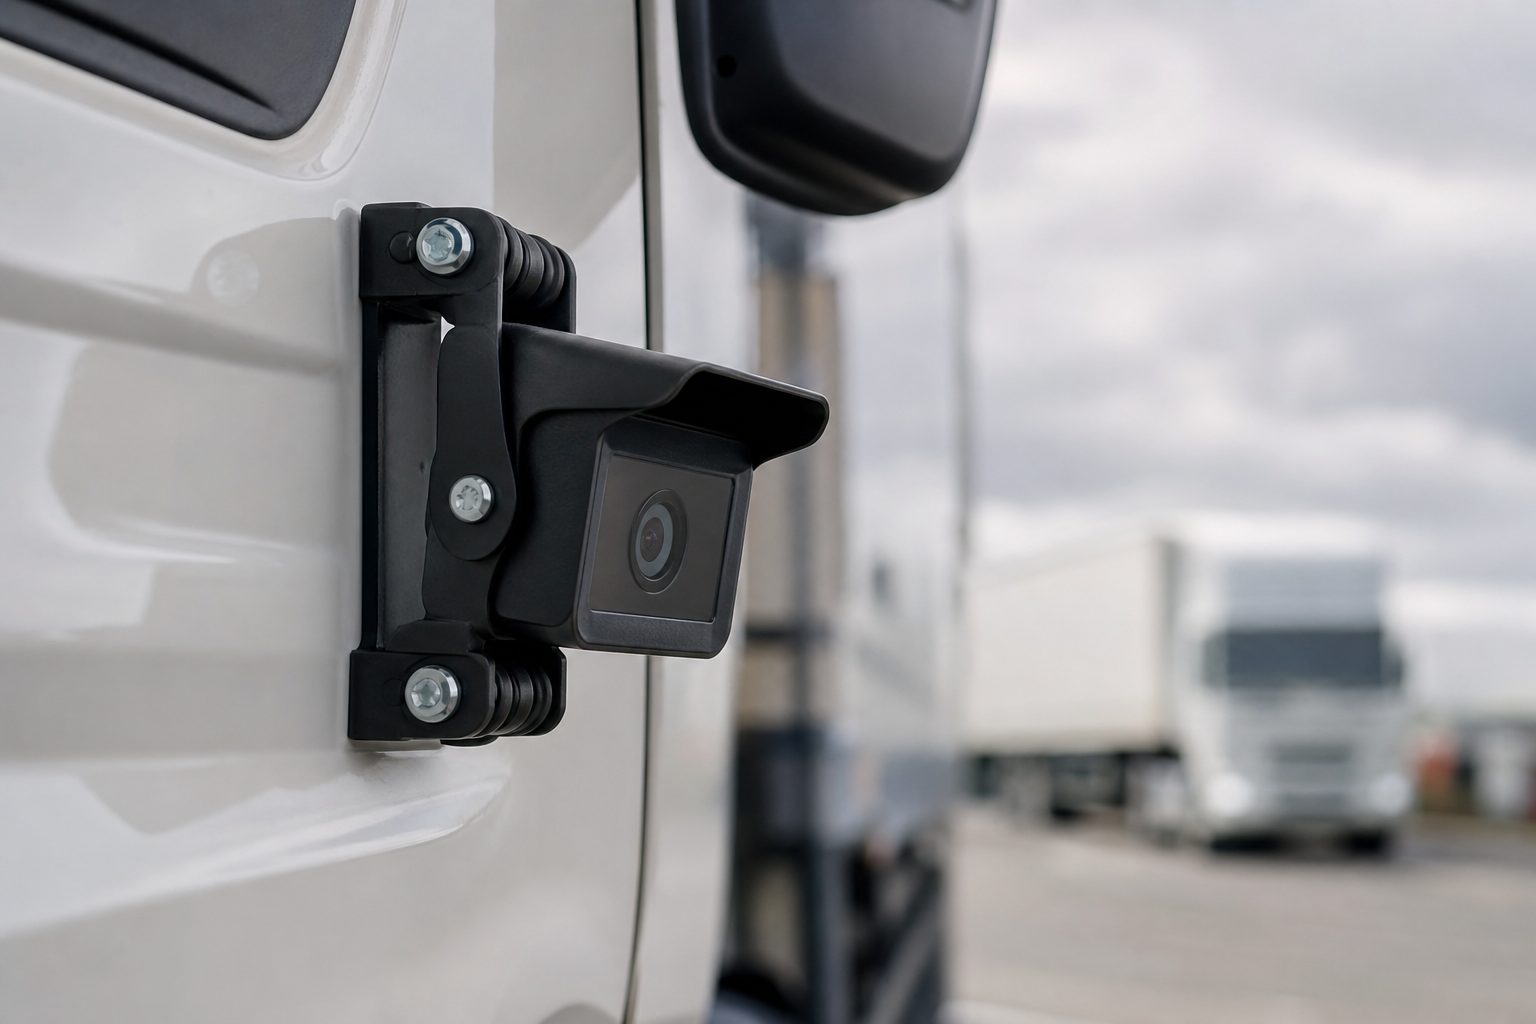
Fleet incident data consistently points to a small number of manoeuvre types — reversing, left turns at junctions, lane changes on dual carriageways — as the situations where contact between a commercial vehicle and a vulnerable road user or another vehicle is most likely to occur. Camera data and telematics do not eliminate these manoeuvres, but they make the risk visible in ways that enable specific action: targeted driver coaching, route modification, equipment reconfiguration, or infrastructure intervention at repeat locations. The fleet that uses camera data reactively — only reviewing footage after an incident — is capturing one fraction of the risk reduction available. The fleet that uses data proactively, to identify manoeuvre patterns before an incident occurs, is extracting the full value.
The Health and Safety Executive identifies reversing as one of the most dangerous manoeuvres in workplace transport operations — nearly a quarter of all fatalities involving workplace transport occur during reversing. For commercial vehicles specifically, a large proportion of accident claims involve a reversing manoeuvre. The risk is concentrated in situations where the reversing vehicle has multiple blind spots, where the reversing area is shared with pedestrians or other vehicles, and where the distance to be reversed is significant enough to lose awareness of changes at the rear.
Junction manoeuvres — particularly left turns at signalised junctions in urban areas — represent the second major concentration of incident risk. Most collisions between heavy goods vehicles and vulnerable road users occur during vehicle manoeuvres or at junctions. The specific mechanism is well established: a cyclist or pedestrian is alongside or in front of the vehicle at a junction; the driver moves off without being aware of their position; the vehicle’s nearside blind spot obscures the vulnerable road user from direct view. MOIS and BSIS sensors address this scenario directly by detecting presence in the frontal and lateral zones before and during the manoeuvre.
Lane changes and merging on dual carriageways and motorways present a different risk profile — one that is more visible in harsh event data than in sensor alerts. A driver who consistently generates harsh acceleration events when merging, or who generates proximity sensor alerts during overtaking, is creating the conditions for a high-speed contact event. Harsh braking events that occur in motorway driving contexts typically indicate following distances that are inadequate for the speed and vehicle weight involved.
Telematics systems generate data on harsh events — braking, acceleration, cornering — but they cannot explain why an event occurred. Camera footage provides the explanation. This is the primary value of combining telematics data with video: the telematics flag identifies that something happened, and the footage shows whether the driver caused it or responded to it.
A harsh-braking event at 8:15am on a specific road segment, when reviewed alongside footage, may show a driver who braked hard to avoid a cyclist who entered the road unexpectedly. That is a legitimate hazard response. The same event type at the same location at the same time three days later, reviewed in footage, may show a different driver braking hard because they were following too close. Two identical telematics flags generate opposite coaching responses when footage provides the context.
For reversing incidents specifically, rear camera footage combined with proximity sensor alert logs creates a risk picture that neither source provides alone. A rear proximity sensor that alerts on every collection run at the same delivery bay is signalling a structural problem: the bay geometry creates the condition for a sensor alert, which may mean it also creates the condition for a contact event if the driver disables or ignores the alert. Camera footage of the reversing approach shows whether the alert represents a genuine pedestrian detection or a static obstacle in the sensor’s detection field — and that distinction determines whether the response is driver coaching, sensor reconfiguration, or a formal risk assessment of the delivery location.
Single events are coaching conversations. Patterns across multiple events are systemic risk signals that require a different response.
Route-based patterns emerge when multiple drivers generate the same event type at the same location. A junction that generates five proximity sensor alerts from three different drivers in a two-week period is not a driver coaching problem — it is a route risk problem. The appropriate response is a route risk assessment: what is the geometry of the junction, where are pedestrians and cyclists crossing, and can the approach be modified to reduce the risk? Where the route cannot be modified, the finding goes into the risk assessment record as a known high-risk location, and drivers on that route receive specific briefing before their first run.
Driver-based patterns emerge when the same driver generates a disproportionate volume of harsh events across different routes and different manoeuvre types. A driver at twice the fleet average for harsh braking, with frequent proximity sensor alerts and multiple near-miss event clips, is a documented high-risk profile regardless of where they are driving. This is the driver who benefits most from footage-based coaching, because the pattern is theirs — not the road’s.
Manoeuvre-type patterns emerge when a specific event category spikes across the fleet simultaneously. A fleet-wide increase in harsh-braking events during a period when no new routes or drivers have been introduced may indicate a change in traffic patterns, a seasonal factor (more cyclists, school start times), or a deterioration in the road surface at a specific location. Camera data does not only identify human risk — it identifies environmental risk that is generating human responses.
Camera data generates risk reduction only when it flows into action. The workflow that converts event data into reduced manoeuvre risk has four stages:
Camera data is only as useful as the equipment generating it. A proximity sensor that generates continuous false alarms — because it is positioned to detect the vehicle’s own loading mechanism, or because it is not configured for the vehicle body type — teaches drivers to ignore it. A driver who ignores sensor alerts has no proximity system, regardless of what is fitted.
Camera data that reveals consistent false alarm patterns at specific locations or vehicle states (loading, lift operation, PTO engagement) is identifying a calibration problem, not a manoeuvre risk. The correct response to this data is sensor reconfiguration — adjusting detection zones, setting PTO-triggered suppression, or repositioning sensors — not driver coaching for an alert they were right to disregard.
Walk test records that confirm each camera and sensor is generating appropriate alerts at each regular interval provide the ongoing evidence that equipment is performing correctly. A fleet whose walk test records show that all sensors are operational and correctly positioned is in a materially different compliance position than one where sensors are fitted but no operational confirmation exists.
Reversing accounts for a large proportion of commercial vehicle accident claims and around a quarter of all workplace transport fatalities. Junction left turns in urban areas represent the second highest-risk category, particularly where the vehicle’s nearside blind spot obscures cyclists or pedestrians. Lane changes and merging at speed on dual carriageways generate the third major concentration of risk — typically visible in harsh-braking and harsh-acceleration event data rather than proximity sensor alerts. Camera systems address each category through different mechanisms: rear cameras and proximity sensors for reversing, MOIS and nearside cameras for junction manoeuvres, forward cameras and telematics for motorway manoeuvres.
Route risk patterns emerge when multiple drivers generate the same event type at the same location. If three different drivers trigger proximity sensor alerts at the same junction within a two-week period, the risk is in the junction geometry, not in any individual driver’s technique. Camera footage of the alerts shows the specific geometry — where pedestrians cross, where the blind spot is most acute — and supports a formal route risk assessment. Route risk assessments that identify high-risk locations allow the fleet operator to brief all drivers on that route before their first run and to document the known risk in the safety management record.
A driver generating events at more than twice the fleet average rate warrants a footage-based coaching intervention. The first step is to review the footage to confirm the events represent genuine technique failures rather than legitimate hazard responses. Where footage confirms the pattern, the coaching conversation uses specific clips from the driver’s own recent journeys — not generic training examples. The coaching session is documented with the events reviewed, the driver’s response, and the agreed action. Where the pattern continues after coaching, the escalation path follows the fleet’s disciplinary procedure. The documentation from the coaching stage supports the disciplinary process if it proceeds.
Yes, with a caveat on causation. Fleets that implement footage-based coaching programmes report reductions in harsh event rates alongside reductions in incident frequency — and the relationship is causal, not coincidental, because harsh events are a documented leading indicator of contact events. However, a reduced harsh event rate achieved by changing driver behaviour is different from a reduced event rate achieved by adjusting the telematics thresholds at which events are flagged. The former reduces risk; the latter reduces the visibility of risk without changing it. Insurers and Traffic Commissioners who request raw event data will quickly identify the difference.
FORS Silver v7 requires monthly walk tests as a minimum standard. The walk test confirms that each camera is operational, that the in-cab display shows the correct image, and that proximity sensors alert at the correct distance. For fleets where camera data is actively used for manoeuvre risk reduction, monthly confirmation that the equipment is generating accurate data is the baseline — equipment that is generating false alarms or failing to alert at the correct distance is producing misleading data, and the coaching or route assessment actions based on that data will be incorrect. Walk test records filed in the vehicle’s maintenance record provide the evidence that safety systems are operational, not merely fitted.
A printable checklist covering five areas: reversing risk controls, junction and VRU manoeuvre risk, harsh event pattern review, equipment calibration checks, and data-to-action documentation.
Tell us what vehicles you run and what you need — we will come back with a recommendation and a price. Prefer to talk? Call 01656 721871.
Related guides: Identifying Dangerous Driving With Video Evidence · Fatigue Detection Techniques for Fleets
4 August 2026
Monday to Friday:
8.30am-5.30pm