Fleet managers know that the visible costs — fuel, tyres, maintenance — are easy to track. What is harder to track is what an unmonitored fleet costs you indirectly: inflated claim settlements that run months, idle vehicles waiting for footage you cannot pull remotely, driver behaviour that goes uncorrected until it causes an incident.
Live view does not reduce operating costs by making vehicles cheaper to run. It reduces them by removing the friction and waste that accumulate when fleet managers cannot see what is happening until it is too late. This guide breaks down the five cost lines where live view has a measurable impact, and explains the mechanism behind each one.
Insurance is one of the largest variable cost lines for a commercial vehicle fleet, and it is one of the most directly affected by connected camera systems. Operators using live view platforms with structured incident response processes present a fundamentally different risk profile at renewal than operators running equivalent vehicles without that capability.
The mechanism is straightforward. Insurers price risk based on their expected claims exposure from a fleet. A fleet that can demonstrate: comprehensive camera coverage, automatic event upload, GPS-synced footage retrieval within minutes of an incident, and a documented history of rapid FNOL submission — is statistically less expensive to insure. Operators with connected camera systems typically report more favourable premium outcomes at renewal.
The compounding effect matters too. Year one, the system is new. Year two, the fleet has twelve months of structured incident data showing how claims were handled and how driver behaviour has changed. By year three, the renewal negotiation is backed by evidence. Each year, the risk profile narrows — and so does the premium.
Claims settlements and legal costs are where unmonitored fleets consistently lose money they should not. Fraudulent claims, inflated personal injury awards, lengthy disputes — all of these cost significantly more when the operator cannot produce contemporaneous video evidence.
The change operators document once live view is in place is stark. Disputed claims fall to a small fraction of their previous level in fleets where camera coverage is comprehensive and footage retrieval is structured. The reason is simple: when a claim is filed, the footage is pulled within minutes, reviewed the same day, and submitted to the insurer before the third-party version of events has had time to become the accepted record.
Staged collision fraud — where third parties deliberately engineer low-speed impacts to claim personal injury — is a documented pattern on commercial routes. Live view footage from forward-facing, nearside, and driver-facing cameras makes these schemes immediately identifiable. A fleet that can defeat one staged collision claim saves more than a full year’s platform subscription cost.
Legal costs scale with dispute duration. A claim supported by clear footage submitted within hours of an incident resolves faster and at lower cost than a contested claim relying on driver accounts and witness statements gathered days after the event.
Fuel is typically the largest single operating cost for a commercial fleet, and driver behaviour has a direct and measurable effect on fuel consumption. Harsh acceleration, excessive speed, unnecessary idling, and sub-optimal gear selection all burn more fuel per kilometre than smooth, attentive driving.
Live view platforms capture driver behaviour data alongside footage — harsh braking events, acceleration patterns, speed relative to limits. When this data is visible to fleet managers and reviewed in conjunction with footage, behaviour changes. Drivers who know that event-triggered alerts are reviewed modify their driving style. Fleets consistently see reduced harsh braking and acceleration incidents within the first 60 to 90 days of deploying a connected camera system.
The practical fuel saving depends on fleet size and baseline driving standards. A 5% reduction in fuel consumption across a 20-vehicle fleet running 60,000 miles per year represents a meaningful operational saving — one that does not require any infrastructure change, just consistent driver behaviour coaching backed by footage.
Route optimisation is a secondary fuel saving. GPS data from the live view platform, combined with footage showing where drivers consistently encounter congestion or make inefficient routing decisions, gives fleet managers the data to identify and correct patterns that would be invisible without the combination of position and video.
Vehicle downtime is an indirect cost that is easy to underestimate. A vehicle off the road for a day while a disputed incident is investigated, or waiting for footage to be manually pulled from a DVR, costs more than just fuel. It costs the revenue or productivity that vehicle was scheduled to generate.
Live view eliminates the need to return a vehicle to depot to review footage. When an incident is reported, footage is retrieved remotely and reviewed within minutes. The vehicle continues its route. The investigation happens in parallel with operations, not as a sequential process that takes the vehicle out of service.
Camera and telematics data also enables proactive maintenance. Harsh braking patterns that recur on specific routes may indicate a driver technique issue, but they may also indicate a vehicle with deteriorating brake performance. Event data visible through the platform gives maintenance teams earlier signals to act on, before a minor issue becomes a breakdown.
Predictive maintenance enabled by telematics and camera data can help reduce vehicle downtime and maintenance costs compared to reactive approaches. Live view does not do this alone — it is one layer of a broader telematics strategy — but it contributes the footage context that makes telematics data actionable rather than abstract.
The time transport managers spend on incident investigation, footage retrieval, and claims preparation is a real cost that rarely appears in operational budgets. Manually pulling footage from a depot DVR, cross-referencing it with driver accounts, and preparing a submission for insurers can consume several hours per incident. For a fleet handling multiple incidents per week, that adds up quickly.
Live view reduces this time significantly. Auto-uploaded event clips are available on the cloud platform immediately. GPS-synced footage means the context is already there — no need to manually match footage timestamps to route data. Encrypted clip downloads are prepared for insurer submission in minutes rather than hours.
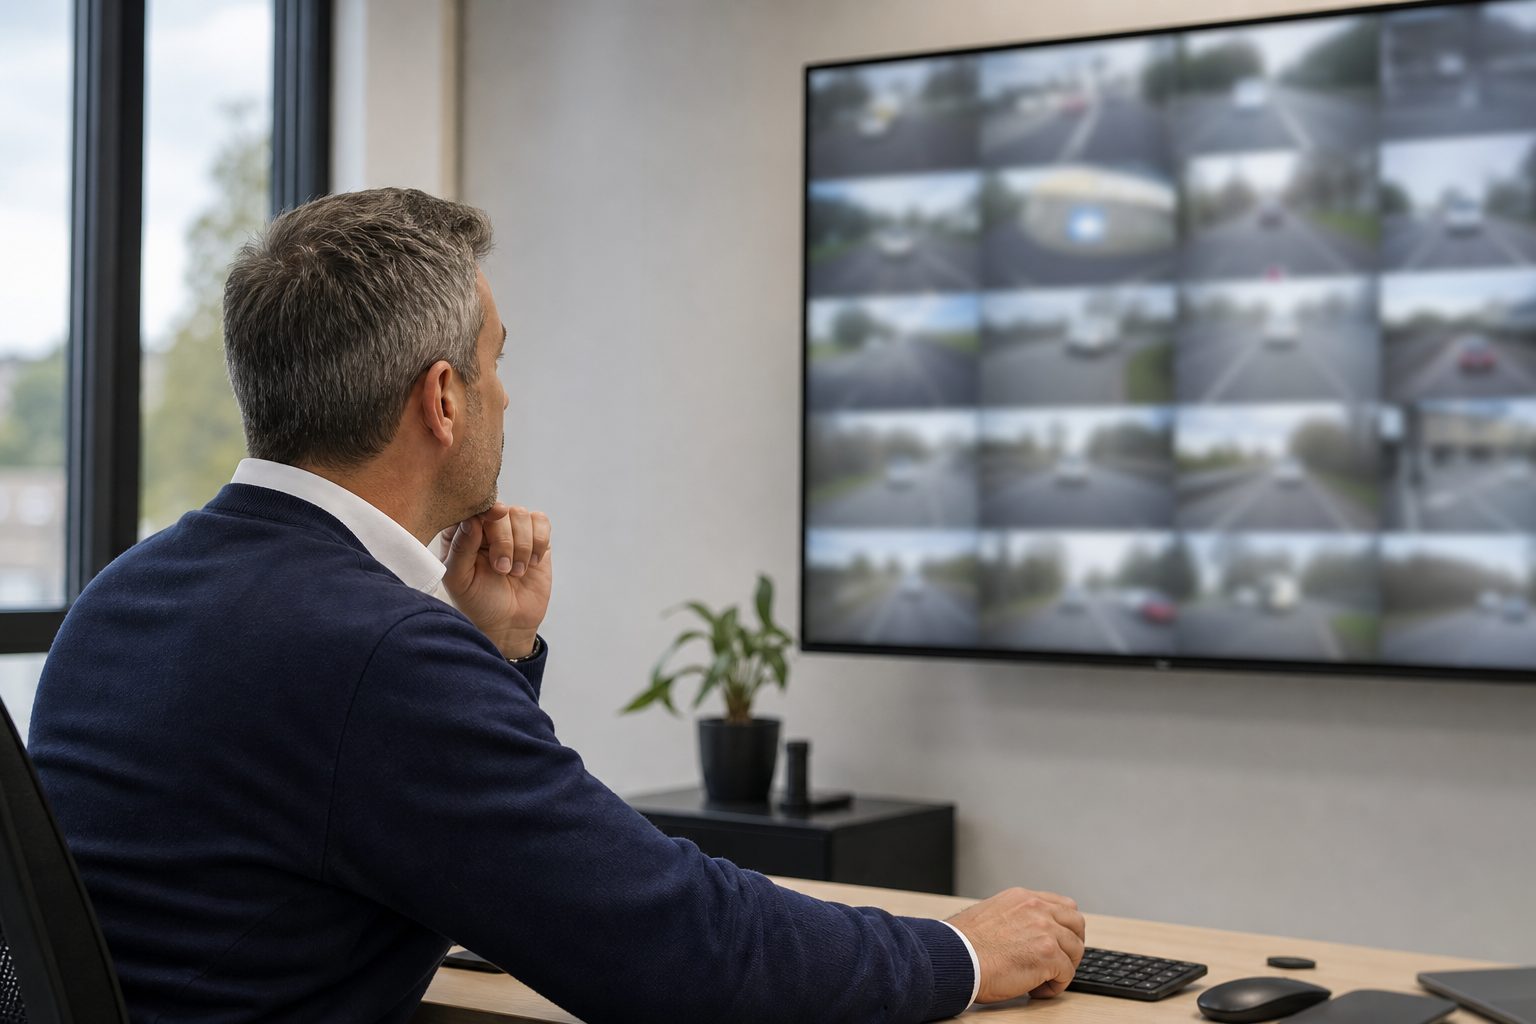
The control room benefit is also real. Without live view, controllers depend entirely on driver calls to understand what is happening on route. With it, they can see what the driver is dealing with, confirm vehicle position, and make operational decisions — rerouteing, replacement vehicles, passenger communications — based on direct visibility rather than second-hand accounts. That operational efficiency has a cost value that is harder to quantify but consistently noted by fleet managers who have made the switch.
Fleet managers evaluating live view systems typically want a simple way to assess ROI. The inputs are more knowable than they might seem:
For most fleets with five or more vehicles and any meaningful claims exposure, the combined saving across these cost lines exceeds the platform subscription cost within the first year. For fleets that have already experienced a fraudulent claim, the comparison is even more direct.
UK operators with connected camera systems typically report improved premium terms at renewal. The reduction depends on the insurer, the fleet’s claims history, and how comprehensively the system covers the fleet. Operators who can demonstrate structured incident response records and consistent evidence retrieval see the strongest outcomes.
For most commercial fleets with regular road exposure, yes — typically within the first year when insurance savings, claim cost reductions, and administration time savings are combined. The payback period is shorter for fleets that have already experienced costly disputed claims without footage to support their position.
Driver behaviour data from the platform — harsh braking, acceleration, speed — gives fleet managers the information to identify and correct high-consumption driving patterns. When drivers know that event-triggered alerts are reviewed, fuel-wasting behaviour reduces. Route data also enables identification of inefficient routeing patterns that are invisible without position and video data combined.
GPS tracking combined with live view gives real-time vehicle location and the ability to view camera feeds remotely. Geofence alerts notify managers immediately when a vehicle leaves an authorised area outside operating hours. Documented cases show that remote footage access has supported police in recovering stolen vehicles and pursuing prosecutions.
Fleet managers consistently report that driver productivity improves when live view is introduced — not because of surveillance pressure, but because the control room has better information. Rerouteing decisions, breakdown responses, and incident management all happen faster when the control room can see what each vehicle is dealing with rather than waiting for a driver call.
The cost is the sum of: avoidable claim settlements where footage would have defeated or reduced the claim; investigation time spent manually pulling footage; the premium uplift that comes from presenting a higher risk profile at renewal; and the operational inefficiency of a control room that depends on driver reports rather than direct visibility.
Insurance savings typically appear at the next renewal — 6 to 12 months after deployment. Driver behaviour improvements and associated fuel savings are typically visible within 60 to 90 days of deployment. Claim settlement savings depend on incident frequency but are immediate in any incident where footage is used.
Smaller fleets see the same per-vehicle economics but lower absolute savings. The case for live view is strongest for fleets above 10 vehicles where the insurance savings alone justify the platform cost. For smaller fleets, the calculus depends more heavily on claims history — one avoided fraudulent claim can represent a significant multiple of the annual platform subscription cost.
Use this checklist to estimate the operating cost savings from live view across five cost lines — insurance, claims, fuel, maintenance, and administration time.
Tell us what vehicles you run and what you need — we will come back with a recommendation and a price. Prefer to talk? Call 01656 721871.
Related guides: How Live View Reduces Insurance Claims: Evidence, Speed, and the FNOL Advantage · Detecting Tampered Cameras With Live View: What Fleet Managers Need to Know
4 August 2026
Monday to Friday:
8.30am-5.30pm